Services Command Center
Are services profitable, is the team's capacity converted into billed work, which projects threaten margin or delivery, and is the backlog healthy against capacity?
Projects, utilization, delivery and service margins. Every dashboard below is finished and ready to run on your data. Book a demo to see them live, page by page.
Are services profitable, is the team's capacity converted into billed work, which projects threaten margin or delivery, and is the backlog healthy against capacity?
How much of the team's time is billable, who and which roles carry it, and where the non-billable time goes.
What the services earn, what moves the margin, and which types, clients and roles create or dilute it.
What each person and role delivers, how the load is balanced, and what each hour of their time earns.
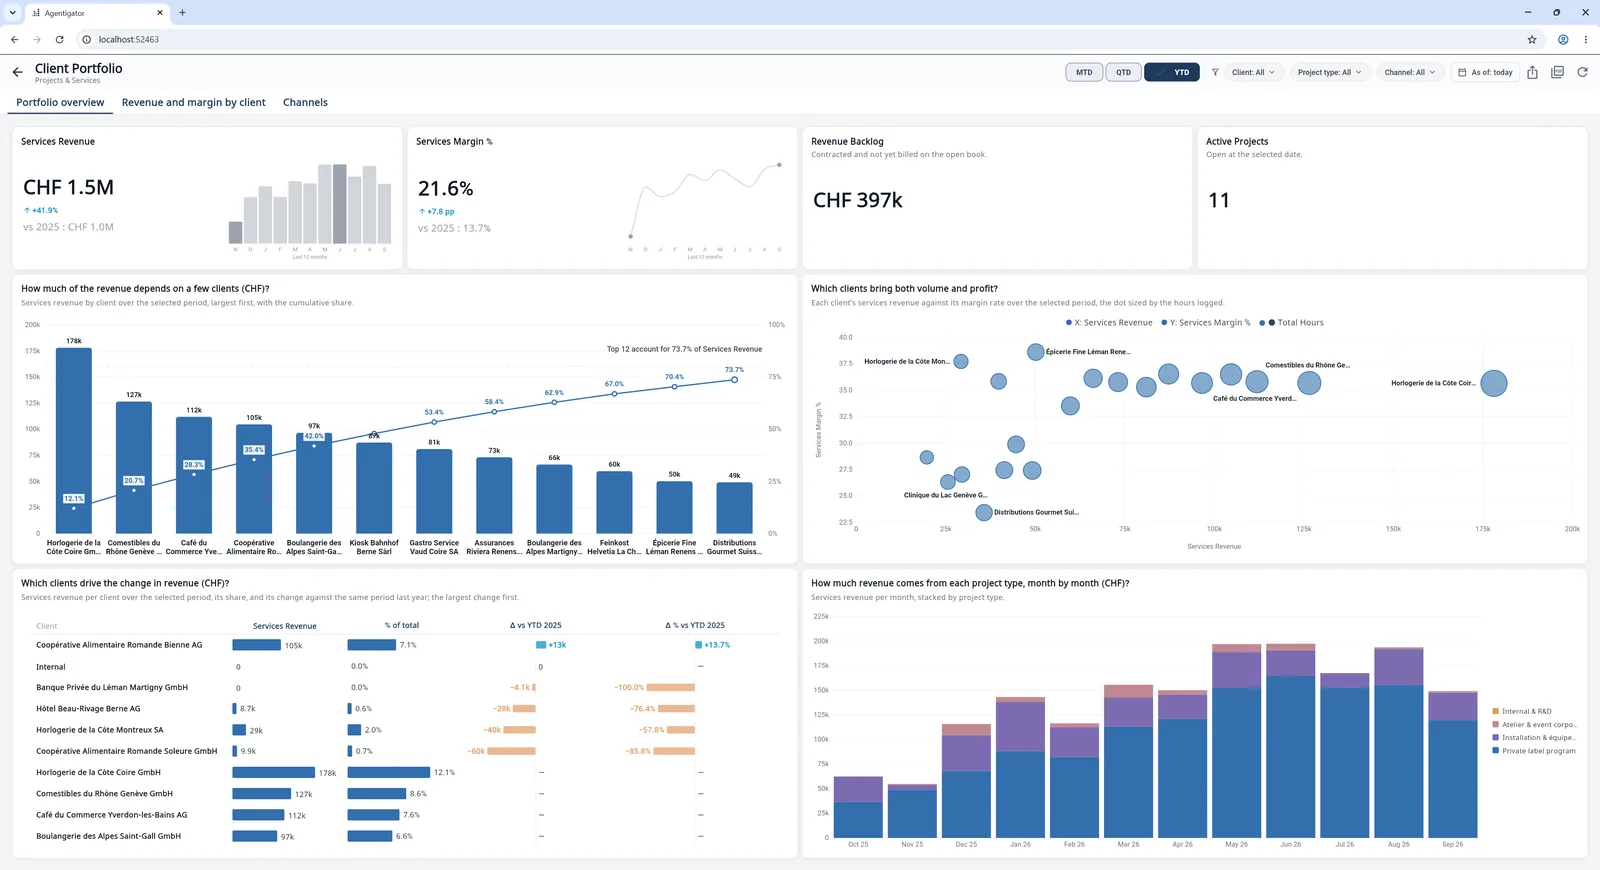
Who buys the services, how concentrated and profitable the client base is, and which channels bring the work.
Of the projects due in the period, how many ran over budget and by how much, and which open projects are heading the same way.
How much work and revenue the open book still holds, when it is due, and how long it will keep the team busy.
How much of the team's time faces the client, what the rest goes on, and what the unbilled and internal time costs.