Finance Command Center
Result, margin, spend and budget: the controller's cockpit.
Receivables, payables, cash, treasury, P&L and statements, always current. Every dashboard below is finished and ready to run on your data. Book a demo to see them live, page by page.
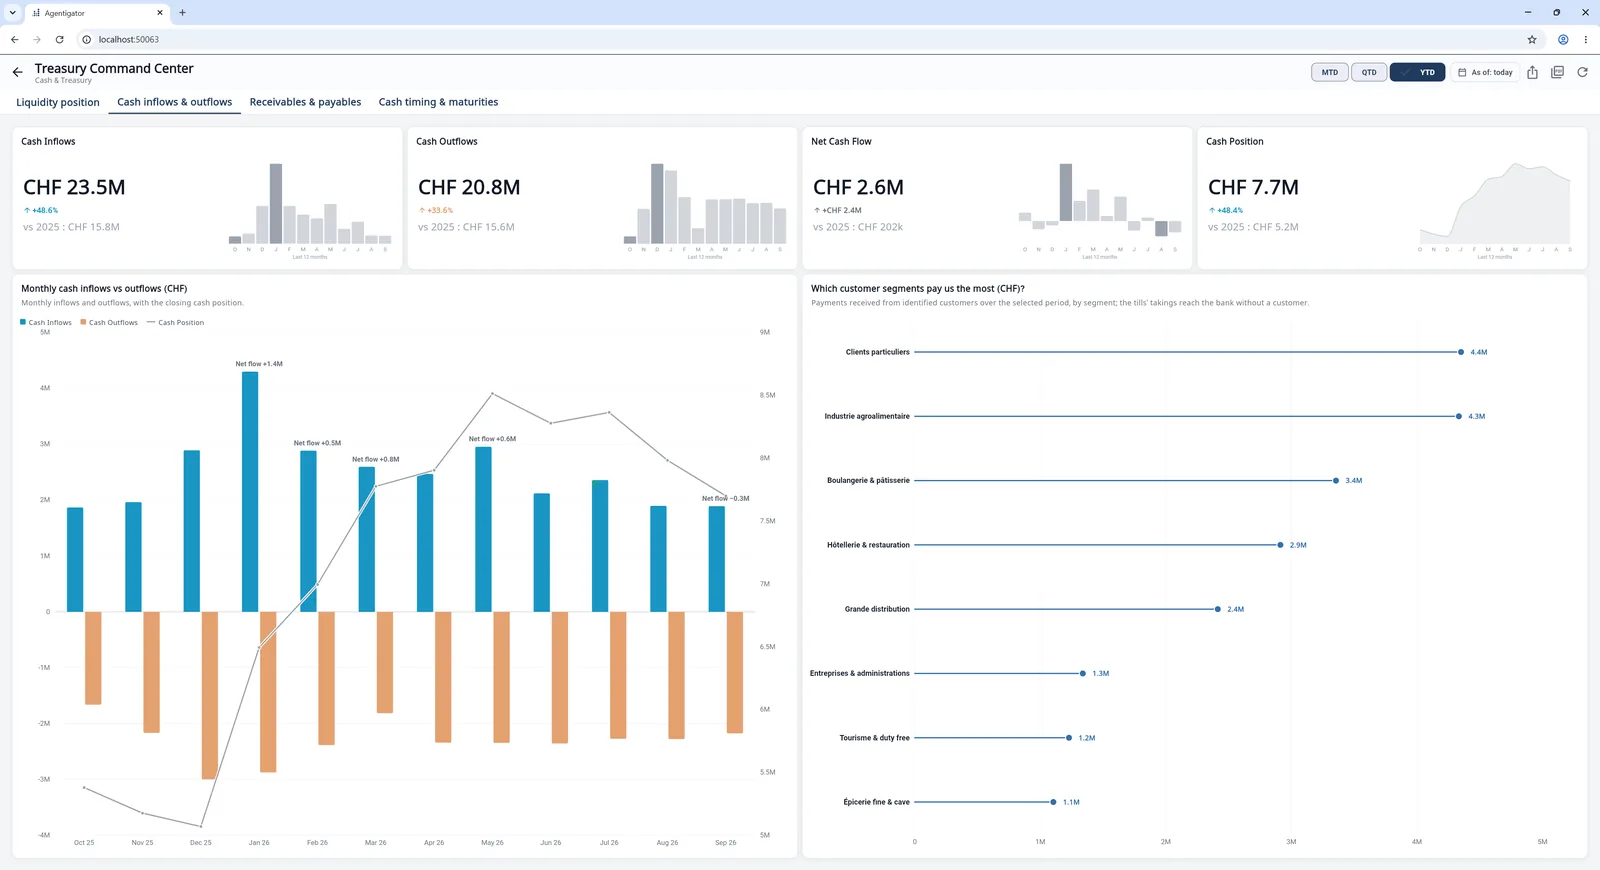
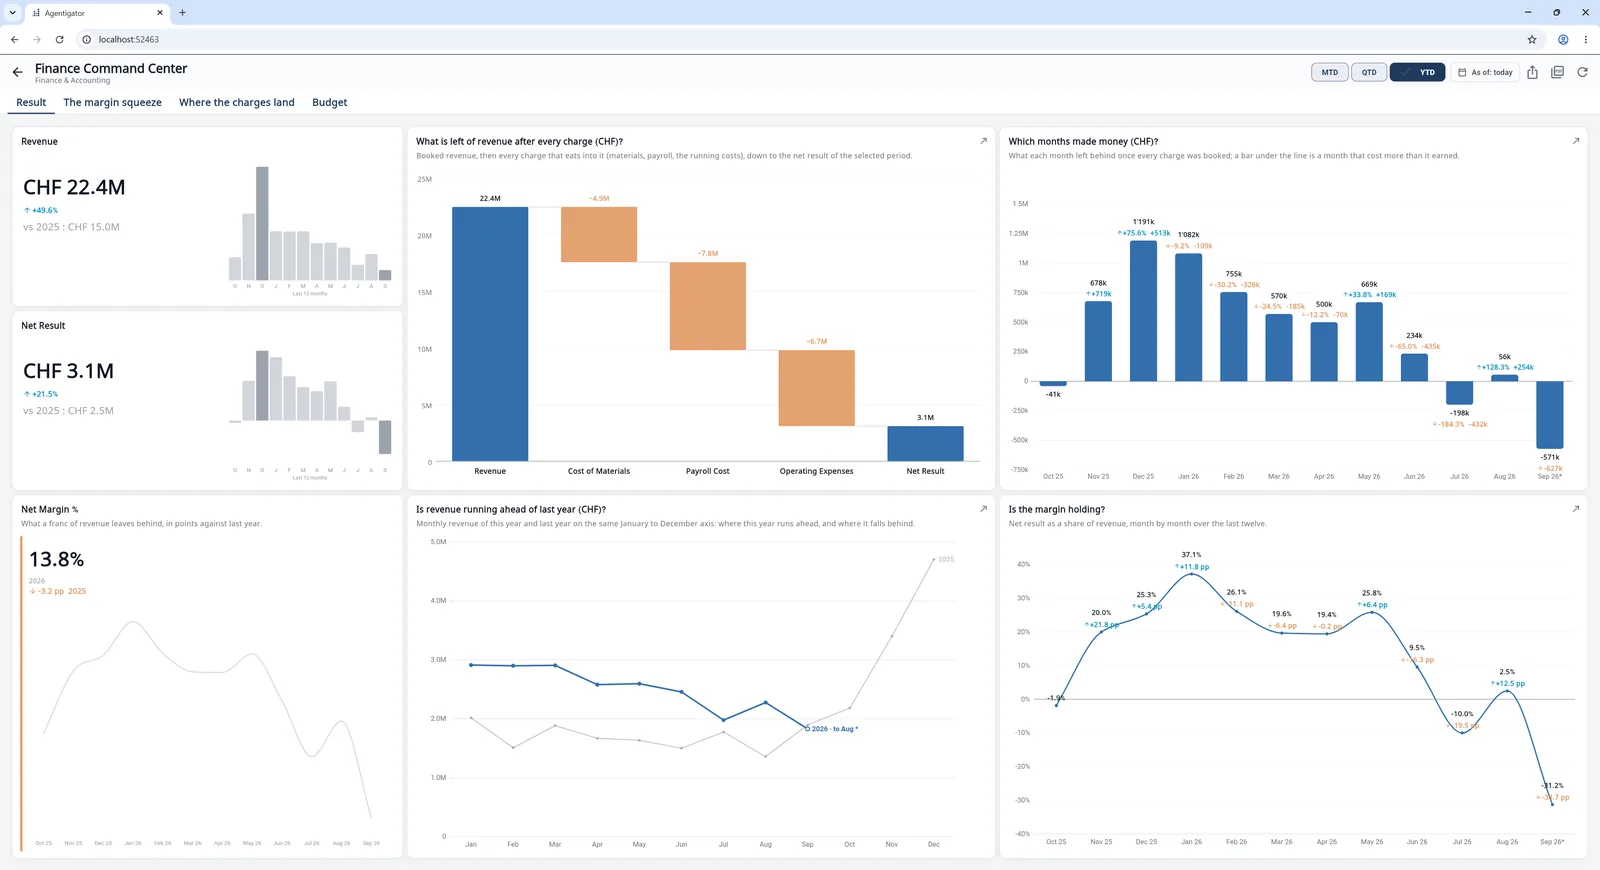
Result, margin, spend and budget: the controller's cockpit.
The gross margin in francs and in points of revenue: what materials changed, and who drove it.
The income statement, line by line and month by month, against last year.
The cost centers against last year: which moved, what their spend is made of, and where each change comes from.
Expenses against the plan: how far off, when, and which cost centers and spend groups carry the gap.
Materials charged against their plan: how far, when, and in which material group.
What the company buys: how concentrated the spend is, and how each spend group's year ran.
The payroll: its weight in the accounts, how it moved, and how it stands against its plan.
The running costs: their weight, how they moved, what drives the change and how they stand against their plan.
How revenue converts into result: what carries through, and whether revenue and margin move together.
What is paid to suppliers, payroll excluded: how much, how concentrated, and what is changing.
The plan across the cost centers: how it was allocated, and how each center holds to it.
The statements: income, balance sheet, cash flow, ratios.
The ledger by account, and the controls that prove it holds.
How equity moved over the period: the result, the dividends and the capital, from the opening to the closing equity.
Receivables, customer risk, billing and collections: the collections cockpit.
Invoiced revenue: is it growing, and what drives it.
The aging map: who owes what, and for how long.
Why DSO moves: the terms, the lateness, and who pays late.
How dependent the receivables are on a few customers.
The collection workload in invoices: how many, how late, how old.
How much of what we quote becomes invoiced revenue.
How much revenue is credited back, how often, and where.
Liquidity, cash movements, receivables and payables, maturities: the treasury cockpit.
The cash account by account: each balance over twelve months, and which accounts moved it.
The cash to come: what falls due over 30, 60 and 90 days, from whom and to whom.