Sales Executive Overview
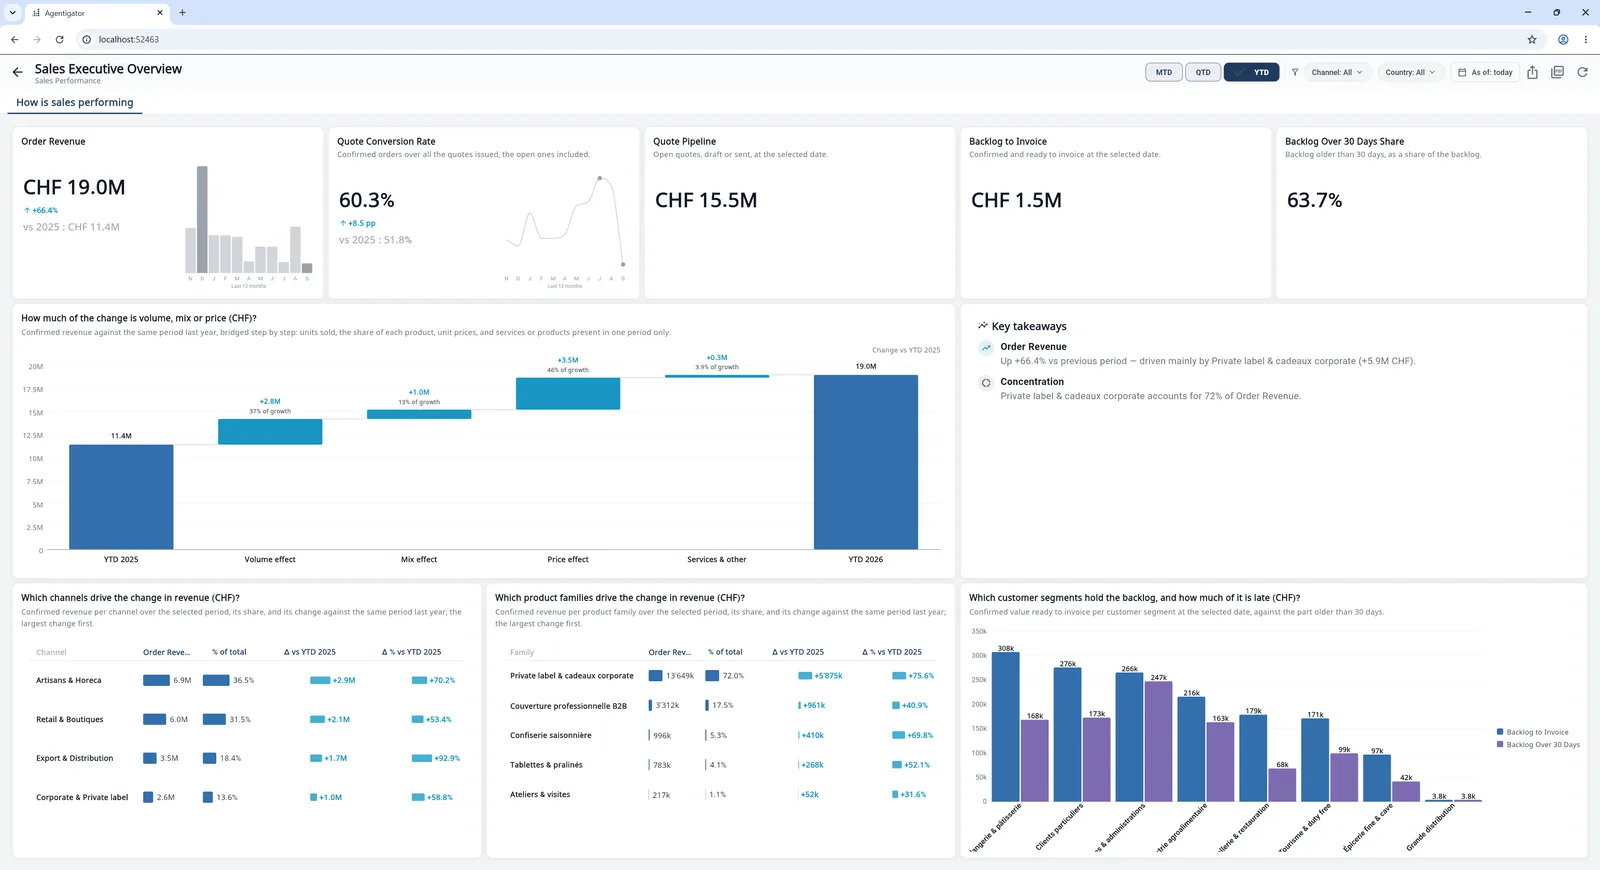
Sales health at a glance: what changed, why it changed, and what is at risk in the quote book and the unbilled backlog.
Pipeline, revenue, pricing, channels and win-loss, from lead to order. Every dashboard below is finished and ready to run on your data. Book a demo to see them live, page by page.
Sales health at a glance: what changed, why it changed, and what is at risk in the quote book and the unbilled backlog.
How revenue is doing, what explains its change, which families, segments, markets and channels carry it.
The open quote book and its age, and how well the quotes issued turn into orders.
How much is won but not yet billed, how old it is, whether it is being worked down, and whom to bill first.
Whether the change in revenue comes from units sold, from unit prices or from the product mix.
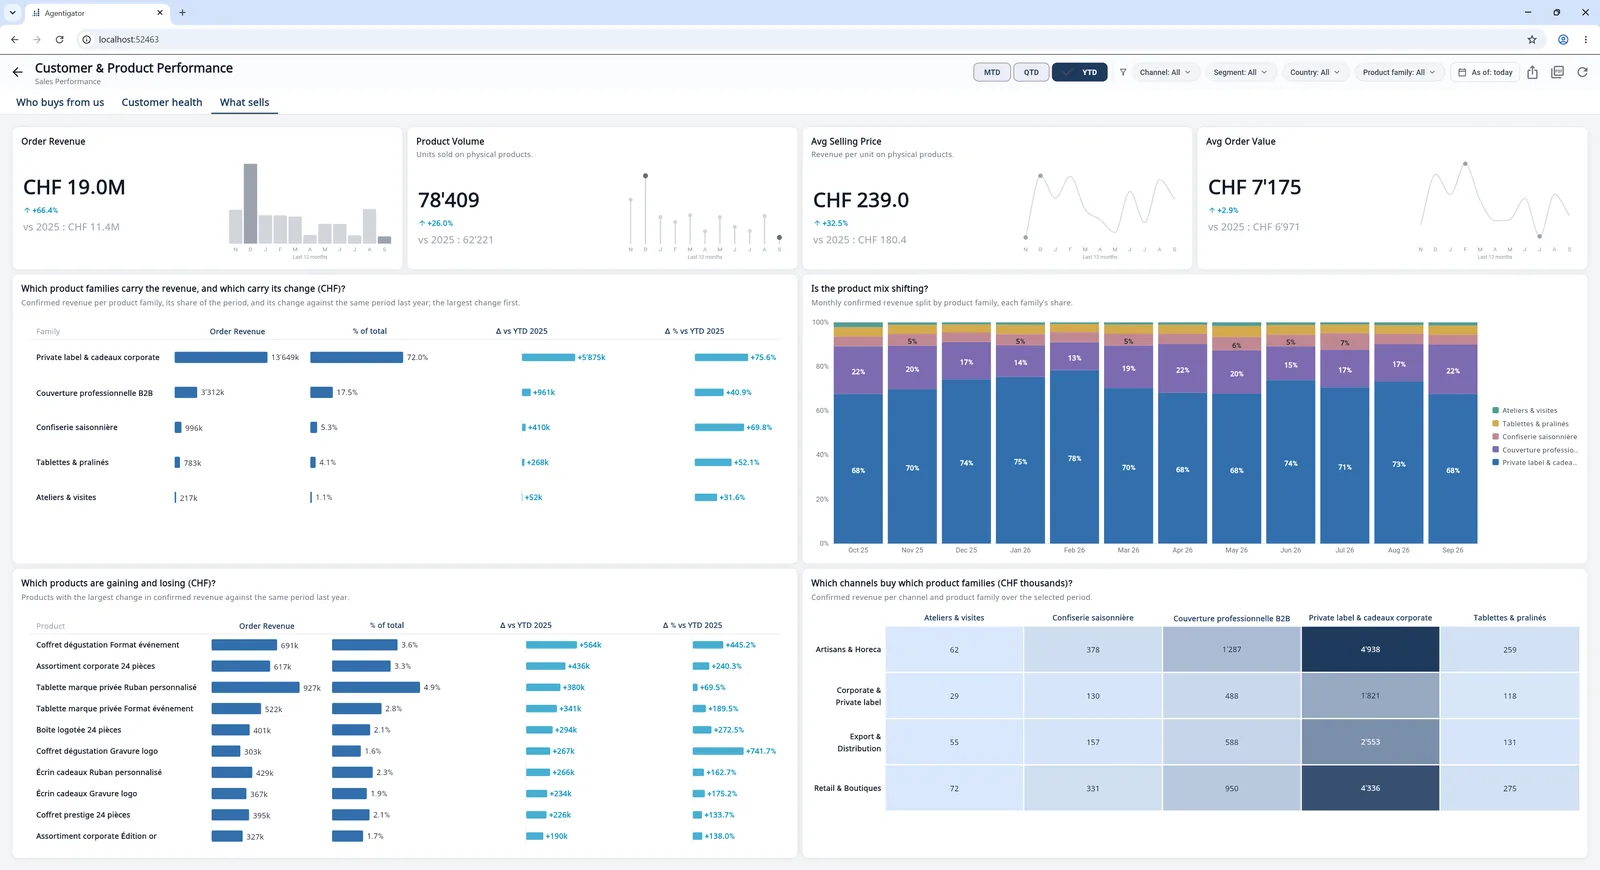
Who buys, how the customer base is doing, and which product families and products drive the revenue and its change.
When sales happen, whether the year repeats, and which product families and channels have their own season.
How healthy the open pipeline is, what is likely to close and when, where the demand comes from, whether it converts: the sales cockpit.
How far the leads of the period get, where they get stuck or lost, and what demand comes in.
Whether we win enough of what we decide, and how deal size and cycle length move the win rate.
Who turns conversion into revenue, who is set up for the next quarter, and where coaching pays.
Which reasons lose deals, how often and how expensively, and where each reason strikes.
What the company quotes and what becomes of it, why it loses and who converts, the open book and its expired part, the credit notes: the sales desk's cockpit.
Why quotations are lost, whether it improves, and where the losses sit.
How long customers take to answer, whether slowness costs the deal, and where the friction sits.
Expired quotes that still look like pipeline. Clean the book.
What gets credited back, at what rate, why, and where it concentrates.
Where the quoted value concentrates, and which customers convert it.
How each deal size converts, how fast it decides and is invoiced, and how the mix moves.
The won quotations followed into invoices: what still waits, since when, and for which customers.
What the tills and the web shop sell, what drove the change, each store's day and year, the web shop against the tills, the basket and the payment mix: the retail cockpit.
Store against store: what each earns per selling day, how it grows, and which months carry it.
What a basket is worth, how baskets are distributed, and which products make them.
The online channel: whether it gains weight, what sells online, and who buys and comes back.
When the tills are busy, per selling day, and what the peaks are made of.